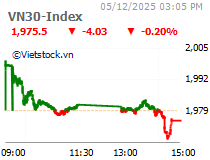
VN-Index
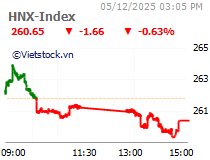
HNX-Index
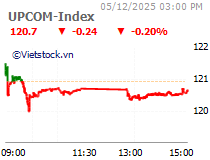
UPCoM-Index
Ngành
Vốn hoá
Total Value
Total volume
Stock code
Listed shares
Shares outstanding
Foreign Buy
Foreign Sell
Bid Volume
Offer Volume
Put-through Volume
Put-through Value
Market Capitalization
Dividend
Reference price
Ceiling Price
Floor price
Open price
Total Value
Total volume
PT Trading Vol.
PT Share Vol.
Foreign Buy Vol
Foreign Sell Vol
Foreign Buy Val
Foreign Sell Val
Matching val
Matching vol
Bid vol
Remain bid vol
Net bid vol
Ask vol
Remain ask vol
Net ask vol
Net F.buy vol
Net F.sell vol
Net F.buy val
Net F.sell val
Pro.buy val
Pro.sell val
Net Pro.buy val
Net Pro.sell val
Pro.buy vol
Pro.sell vol
Net Pro.buy vol
Net Pro.sell vol
Revenue quarter
Profit quarter
Total assets quarter
Owner's equity quarter
Revenue 4 quarter
Revenue year
Profit year
Total assets year
Owner's equity year
Profit 4 quarter


Select source
All
HOSE
HNX
UPCOM


Group by
NAICS sector
VS-Sector
Exchange
Market cap
No group


The detail of NAISC sector
All
Agriculture Production
Mining, Quarrying, and Oil and Gas Extraction
Utilities
Construction and Real Estate
Manufacturing
Wholesale Trade
Transportation and Warehousing
Information and Technology
Finance and Insurance
Rental and Leasing
Professional, Scientific, and Technical Services
Management of Companies and Enterprises
Administrative and Support and Waste Management and Remediation Services
Educational Services
Health Care and Social Assistance
Arts, Entertainment, and Recreation
Accommodation and Food Services
Public Administration
Other Services (except Public Administration)
Retail Trade

Trading
Ordering
Proprietary
Foreign
Price
Financial
Market Cap 
Trading value
Matching value
Put-through value
Trading volume
Matching volume
Put-through volume
Bid vol
Remain Bid
Net Bid
Ask vol
Remain Ask
Net Ask
Proprietary buy value
Proprietary sell value
Net proprietary buy value
Net proprietary sell value
Proprietary buy volume
Proprietary sell volume
Net proprietary buy volume
Net proprietary sell volume
Foreign buy value
Net foreign buy value
Foreign sell value
Net foreign sell value
Foreign buy volume
Net foreign buy volume
Foreign sell volume
Net foreign sell volume
% Price change increase
% Price change decrease
Close price
Reference price
Ceiling price
Floor price
Revenue quarter latest
Profit quarter latest
Total assets quarter latest
Owner's equity quarter latest
Revenue 4 quarter latest
Revenue year latest
Profit year latest
Total assets quarter latest
Owner's equity quarter latest
Profit 4 quarter latest


Shape
Rectangle
Polygon
Circle

Color
01
02
03
04
05
06
07
08
09
10
11
12
13
14
15
16
17
18
Save template
Vietstock's template
Trade Val


Share
 Copy link
  Facebook
 Low JPEG High JPEG Ultra high PNG


Color option
Name
Ceiling
Background
Color
Increase
Background
Color
Unchange
Background
Color
Decrease
Background
Color
Floor
Background
Color
Gradient
Filters
Exchange
All ▼
NAICS sector
All ▼
Market cap
All ▼
Trading val
0
3,000
Trading vol
0
500
Matching val
0
3,000
Matching vol
0
500
Put-through val
0
3,000
Put-through vol
0
500
F.Buy val
0
3,000
F.Sell val
0
3000
F.Buy vol
0
500
F.Sell vol
0
500
% price change
-7.00
7.00
Close price
0
600,000
Reference price
0
600,000
Floor price
0
600,000
Ceiling price
0
600,000
Save template
Name VN
The link copied

Share
Copy link Facebook 


The link copied
Share
Copy link Facebook The link copied
Top stocks contributing to increase: Top stocks contributing to decrease:
| Stock | Price | Change |
|---|
| Stock | Vol | Price | Change | P/E | P/B | EPS | Market Cap. |
|---|
Foreign Investor Trading The graph shows the transaction of foreign investors on HOSE, HNX and UPCOM over time and by securities structure.
The scope of securities includes: stock, fund certificate and ETF.
The scope of securities includes: stock, fund certificate and ETF.
Share
Copy link Facebook The link copied
Proprietary Trading Proprietary trading is a transaction in which a securities company buys and sells securities for itself for the purpose of making profits.
The graph shows the transaction of proprietary trading on HOSE, HNX and UPCOM over time and by securities structure.
The scope of securities includes: stock, fund certificate and ETF.
Note: This data is updated at the end of the trading day.
The graph shows the transaction of proprietary trading on HOSE, HNX and UPCOM over time and by securities structure.
The scope of securities includes: stock, fund certificate and ETF.
Note: This data is updated at the end of the trading day.
Share
Copy link Facebook The link copied
GOODS
Gold: SJC
Crude Oil

$
Copper

Coffee

Gas

CURRENCY
US Dollar Index:


Vietstock’s industry classification
Vietstock applied NAICS 2007 (The North American Industry Classification System) for industry classification because of its popularity, comprehension and logical order. In addition, it receives many supports from international organizations and bears a lot of similarities to Vietnam Standard Industrial Classification (VSIC 2007).

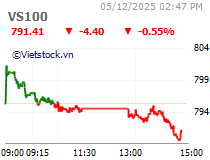
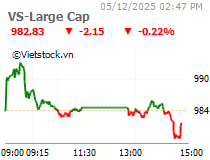
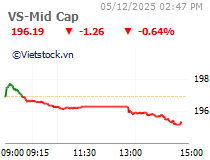
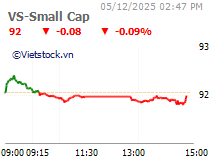
Vietstock Indicies
Vietstock applied free-float adjusted market-capitalization method for Vietstock Indicies (VS Sector Index, VS Market Cap Index và VS 100 Index).